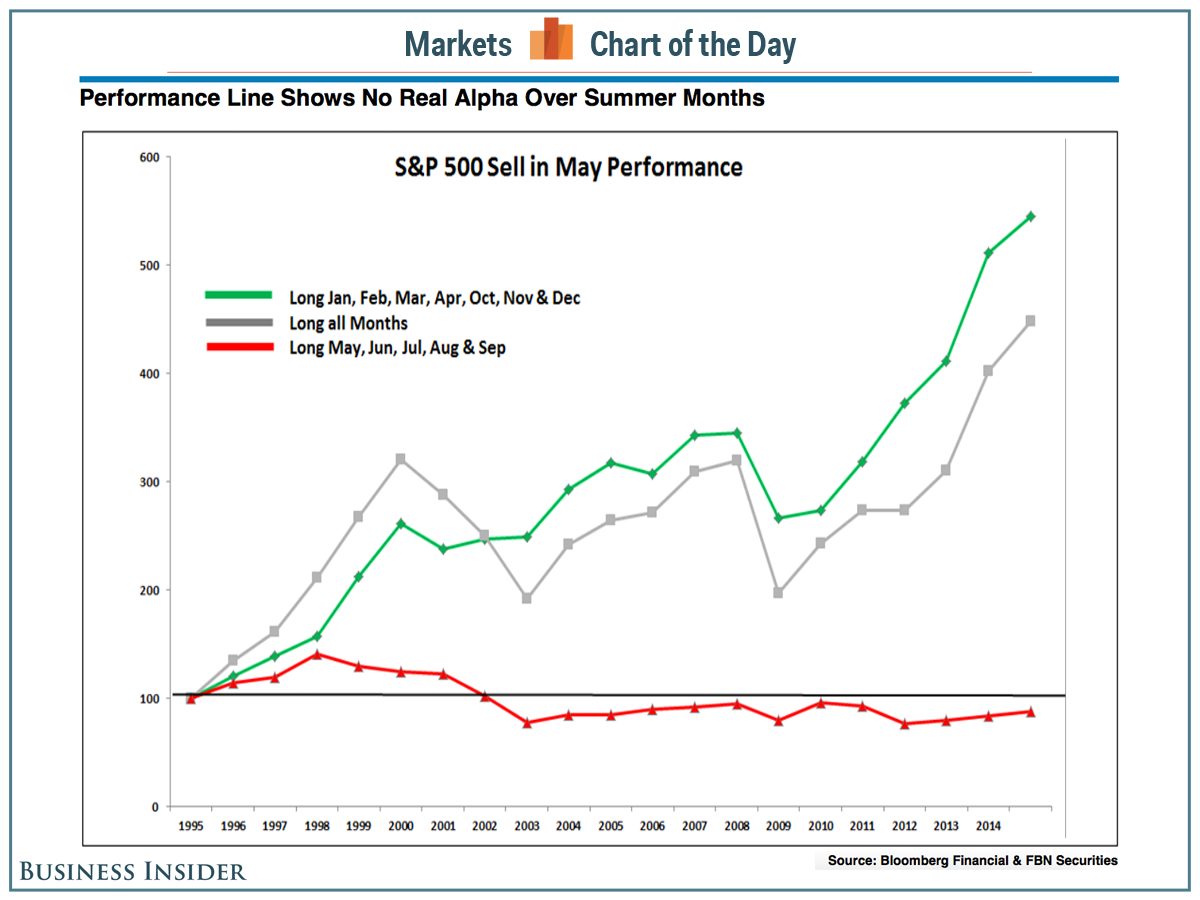
One of the most enduring of Wall Street axioms – falling somewhere under “buy low and sell high” but above “greed is good” – is to “sell in May and go away” and, indeed, there appeared to be some truth to the saying. Between 1950 and 2012, the Dow Jones gained an average of 7.6% annually during the November-April period, but only 0.4% during May-October. Does “Sell In May and Go Away” still hold true as a viable investment strategy? Not according to my analysis as put forth in this article.
HERE are the details from the original post.
GO HERE for more on the merits of selling in May & going away.

Check out these articles too:
“Sell In May” Often A Big Mistake Historically
Myth Or Reality: ‘Sell In May’
Related Articles from the munKNEE.com Vault:
1. May Day! May Day! Should You “Sell in May and Go Away”?
Many articles have been posted today, May 1st, regarding the investing adage “sell in May and go away”. Below are links to 10 such articles on the subject to help you decide what course of action you should take. Read More »
2. Stocks: ‘Sell In May And Go Away’ – or Even Sooner! Here’s Why
Taking profits is rarely a bad idea, and staying fully invested at these levels seems foolish. That is why it might pay to raise some capital now, before the sell in May strategy comes up. Having a core position of equities along with some dry powder and keeping a look out for short-term trading opportunities is how I plan to play this market through 2013. [This article presents 5 specific reasons why it might be wise sell in May and go away – or even sooner – this year.] Words: 1280 Read More »
3. Stop! If You Sell in May and Go Away This Year You’ll Regret It – Here’s Why
The adage “sell in May and go away” refers to selling one’s stocks in May, going into cash, and then waiting until November before buying back into the market. That] has worked the past two years…[This time round, however,] we believe there is a high probability that you would be buying at a higher price [in November] than… [what if you were to sell out] in May of 2012. [Let us explain why we are of that view.] Words: 406 Read More »
4. The Best Times to Buy & Sell (or not) Your Stocks to Maximize Returns
Statistically speaking there is an optimal time to buy or sell a security and knowing such, or at least knowing when not to do so, would be quite beneficial to your financial health. This article provides the answers as to what are the best months, and work its way down to half-hours of the trading day, to engage in trading. Read More »
5. Time the Market With These Market Strength & Volatility Indicators
There are many indicators available that provide information on stock and index movement to help you time the market and make money. Market strength and volatility are two such categories of indicators and a description of six of them are described in this “cut and save” article. Read on! Words: 974 Read More »
6. Yes, You Can Time the Market – Use These Trend Indicators
Remember, the trend is your friend and now you have an arsenal of such indicators to make an extensive and in-depth assessment of whether you should be buying or selling. If ever there was a “cut and save” investment advisory this article is it. Words: 1579 Read More »
7. Make Money! Time the Market Using Market Strength Indicators- Here’s How
There are many indicators available that provide information on stock and index movement to help you time the market and make money. Market strength and volatility are two such categories of indicators and a description of six of them are described in this “cut and save” article. Read on! Words: 974 Read More »
8. Part 1: Should Financial Market Cycles Play A Role In Your Decision-making Process?
Financial markets are influenced by relatively predictable cycles…[and should] play a big role in one’s decision-making process just as they do in our day-to-day lives. This article, part 1 of a 3 part series, takes a look at several and discusses their relevance to one’s investment management process.
9. Part 2: What Role Do Oscillators, Standard Deviation & Mean Reversion Play In YOUR Investment Management Process?
In the investment management process…[it is important to] actively monitor both short- and long-term cycles…in order to manage expectations based on historical patterns…[as well as] oscillators – diagnostic tools that help us measure a security’s upward and downward price volatility. To understand how oscillators work, though, you first need to become familiar with standard deviation and mean reversion. In this article, part 2 of a 3-part series, we do just that.

 munKNEE.com Your Key to Making Money